Algorithmic Art - A Case Study

Introduction
Algorithmic Art is a creative blend of programming, design, and the arts. This project uses computing algorithms to produce compelling images. Some of these algorithms arise from The Traveling Salesman Problem, or TSP. A famous problem in Computer Science, TSP essentially asks: given a set of points, commonly defined as cities on a map, how do we find the shortest route that covers all the points exactly once? Many algorithms have been proposed as solutions to the TSP, two of which I’ll cover later in this case study.
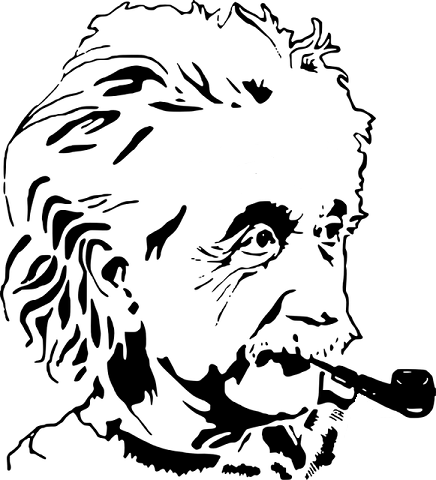
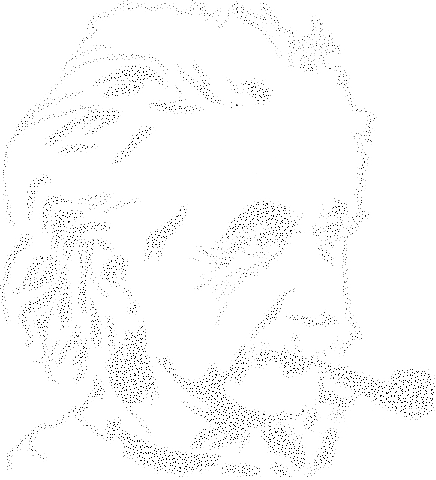
TSP art applies the concepts and heuristics of the Traveling Salesman Problem to the realm of the arts. After all, an image is nothing more than a matrix of pixels, or tiny dots of color. If we view these dots as the set of points in the traditional Traveling Salesman Problem, then we can apply TSP heuristics to an image. The basic process is as follows: we take an image, create a “stippled” or dotted version of the image, and then connect the dots using a TSP heuristic. The resulting image is one long, uninterrupted line that connects all the dots.
For example, the images below illustrate the steps of the process:
My Process
In creating the Algorithmic Art program, I employed an iterative process using stepwise refinement to gradually build the program. I used JavaScript and HTML Canvas to create the program.
First, I needed to find a simple way to obtain the pixel data for an image. Fortunately, the HTML Canvas element has a handy method called getImageData that returns an array of RGBA values for each pixel in the canvas. In my program, I obtain the pixel data with this simple line of code (where width and height are the width and height of the image):
var imageData = context.getImageData(0, 0, width, height);
After this line executes, the array of pixel data is stored in the variable imageData.
Next, I created a stippled version of the image. To accomplish this step, I constructed a grid from the image, where each cell in the grid is a certain dimension, such as 3x3, 4x4, 5x5, etc. Each of these cells holds a single pixel to represent all the pixels in that particular cell. The single pixel’s color is the average color of all the pixels in that region. This technique creates a stippled picture that retains the colors of the original image.
As I worked on this step of the process, I initially placed each pixel in the center of each cell. However, the results were too uniform (see left image below). So instead of placing each pixel in the center of a region, I decided to place the pixel in a random location in the region (see right image below). This improvement resulted in a more stippled appearance:

After creating the stippled image, the next step was to create the actual lines to connect the dots. This is when I implemented a TSP heuristic known as the nearest neighbors heuristic. It is a straightforward heuristic: for each point, we choose the nearest point from all the other unvisited points, and mark the current point as “visited”. Then we repeat the procedure until we have visited all the points. Pretty simple! Note that this “greedy” approach does not necessarily result in the shortest tour; nonetheless, it is a simple procedure.
The nearest-neighbors heuristic was surprisingly easy to implement. As usual, I broke it down into steps. First, I decided to momentarily set aside the image-processing code in order to work with a simpler data set. I created a canvas with a small number of randomly-placed dots, and I used that dataset while implementing the nearest neighbors heuristic. Working with a simpler data set rather than an entire image allowed me to focus on the algorithm itself, and helped ensure that the code was working properly with some simple data. The example below from Codepen illustrates this part of my process:
See the Pen TSP with Nearest Neighbors by Kristen Webster (@kristenwebster) on CodePen.
Then I began testing my code with simple images such as shapes. Initially, I only used black-and-white images, once again to simplify the procedure and ensure that everything was working properly. Then I added color to the images, and I experimented with all sorts of images in order to test my code. This testing process revealed that certain kinds of images produce better TSP art than others. For example, images with a lot of fine-grained details or subtle color gradients don’t translate well to TSP because many of the details are lost due to the stippling.
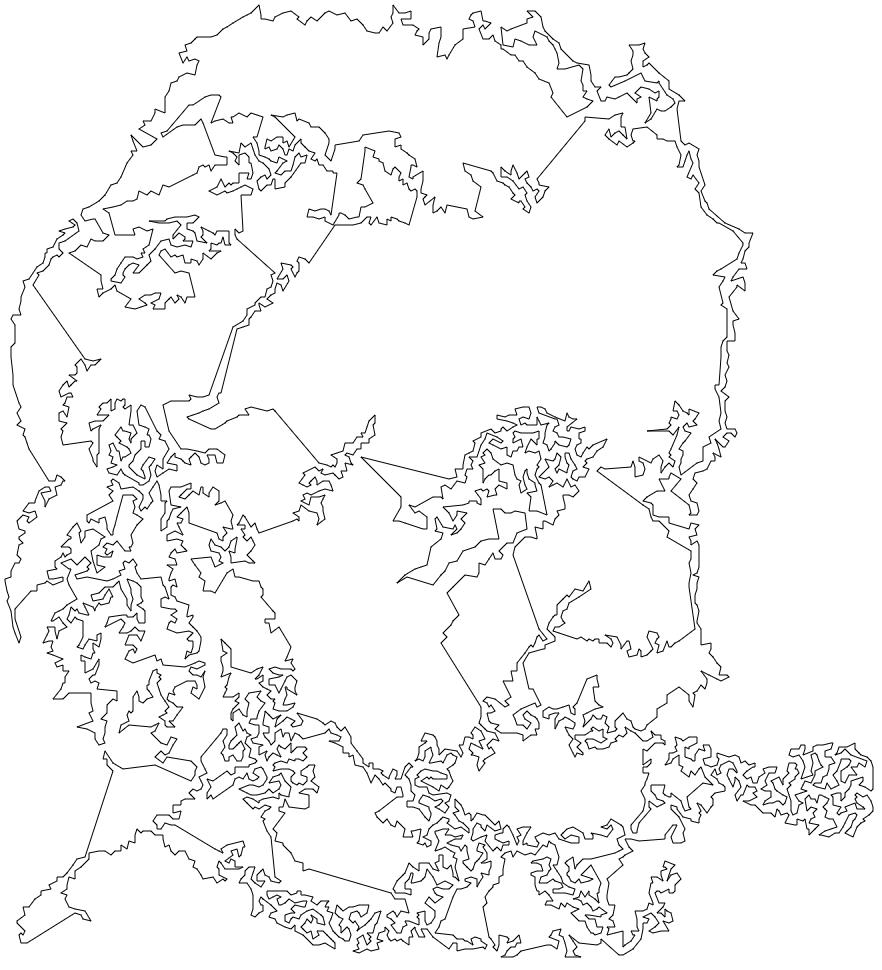
After the nearest neighbors heuristic was working properly, I realized that I would need to improve my algorithm in order to produce good-looking images. The nearest neighbors heuristic resulted in many long lines being drawn across the image:
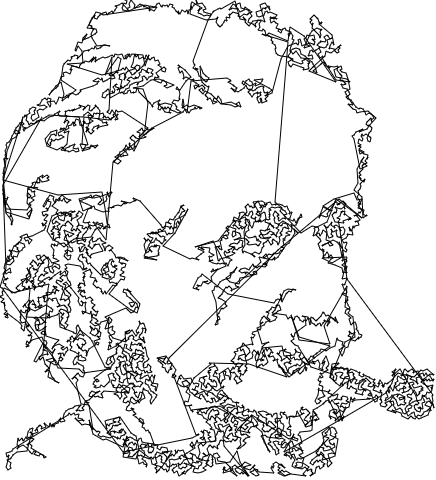
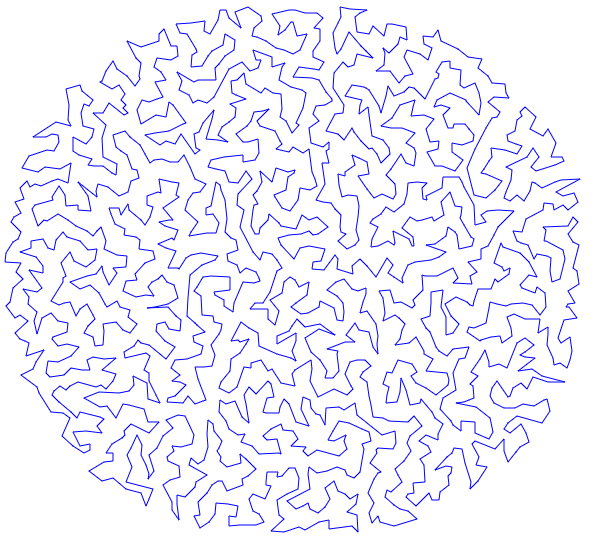
In order to improve the images, I implemented the 2-Opt heuristic. 2-Opt improves an existing TSP tour by swapping certain edges if the resulting path creates a shorter tour. The heuristic works as follows: we calculate the distance between every pair of points, and if we find a distance that is shorter than the current distance, we swap endpoints. This results in a shorter overall tour, as well as vastly improved TSP art:
After I implemented the 2-Opt heuristic, I continued to experiment with a wide variety of images. Moreover, I added features to the user interface in order to improve the user experience and aid my own debugging and testing process. I also experimented with adding color to the images, which creates even more options for producing algorithmic art:

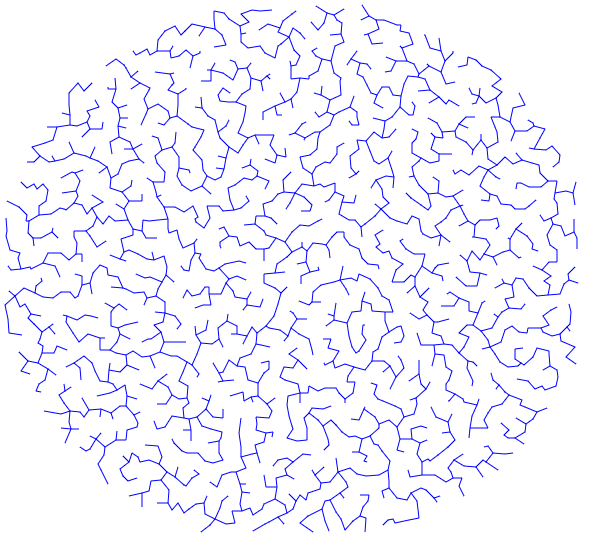
The realm of algorithmic art is not limited to TSP. I also implemented a Minimum Spanning Tree (MST) algorithm, which produces a different artistic appearance than TSP algorithms:
Results & Lessons Learned
This was a fun, enriching project that allowed me to express both my creativity and my coding ability. The possibilities are endless, and I plan on continuing this project to create more elaborate TSP art.
One important lesson I learned from this project was the value in creating a user interface that aids debugging and experimentation. Initially, I hard-coded certain parameters such as the line width, the zoom factor, and the region size for the image stippling. This created unnecessary extra work, as I had to recompile and rerun the code every time I wanted to change a simple parameter. After I added those features to the UI, testing various images became more efficient and fun.
Another lesson I learned was the importance of algorithm analysis and choosing the best algorithm for the situation. Nearest neighbors is easy to implement, but it doesn’t produce appealing TSP art. By contrast, 2-Opt produces lovely TSP art, but it is slower than nearest neighbors. For this particular application, the longer runtime is worthwhile because the resulting images are so much more pleasing.
View the art galleryReferences
Traveling Salesman Problem on WikipediaNearest neighbors algorithm on Wikipedia
2-Opt algorithm on Wikipedia
Minimum spanning tree on Wikipedia